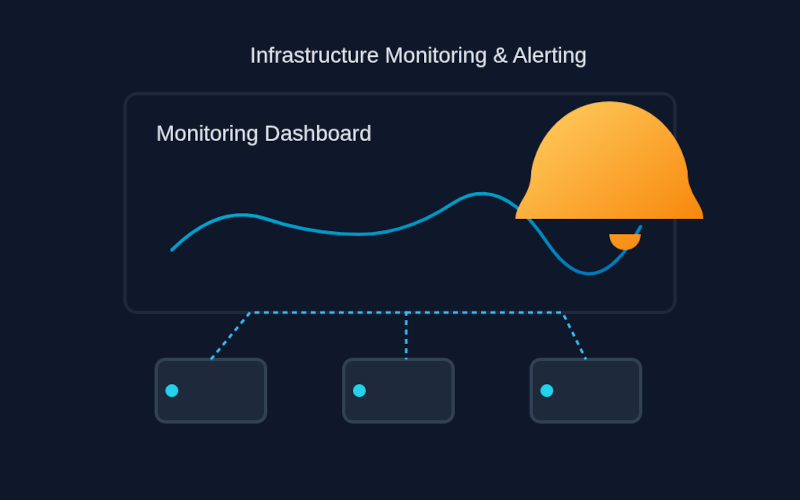
Icinga2 Monitoring Infrastructure
A comprehensive distributed monitoring solution using Icinga2 and Icinga Web 2 deployed across AWS EC2 and Docker containers for enterprise-grade service monitoring.

Project Overview
This project implements a distributed monitoring infrastructure using Icinga2 and Icinga Web 2 across multiple environments. The architecture consists of a master monitoring server on AWS EC2 and two Docker containerized clients (web and database servers) running Ubuntu 14.04.4 LTS.
The monitoring solution provides real-time service health checks for Apache2 web services and MySQL database servers, with a centralized web interface for visualization and alerting. The deployment leverages Docker containers for isolated monitoring targets while maintaining seamless communication through network configuration.
Platform: AWS EC2 + Docker | OS: Ubuntu 14.04.4 LTS (Trusty Tahr) | Monitoring Targets: HTTP & MySQL Services
Infrastructure Architecture
Master Server
- Platform: AWS EC2
- OS: Ubuntu 14.04.4 LTS
- Role: Icinga2 Master + Web Interface
- Hostname: ip-172-31-46-140
- IP: 172.17.0.1
- Services: Icinga2, Icinga Web 2, LAMP Stack
Web Server (mosudi.web)
- Platform: Docker Container
- OS: Ubuntu 14.04.4 LTS
- Role: Apache2 Web Server
- Hostname: web.mosudi
- IP: 172.17.0.2
- Ports: 804:80, 10004:10000
- Monitored Service: HTTP
Database Server (mosudi.db)
- Platform: Docker Container
- OS: Ubuntu 14.04.4 LTS
- Role: MySQL Database Server
- Hostname: db.mosudi
- IP: 172.17.0.3
- Ports: 805:80, 10005:10000, 3309:3306
- Monitored Service: MySQL
Key Features
Distributed Monitoring
Master-client architecture with Icinga2 deployed across AWS EC2 and Docker containers, enabling scalable and isolated monitoring targets.
Service Health Monitoring
Real-time monitoring of Apache2 HTTP services and MySQL database connectivity with customized health checks and performance metrics.
Web-Based Dashboard
Icinga Web 2 interface with MySQL IDO backend for centralized monitoring visualization, alerting, and comprehensive reporting capabilities.
Installation & Configuration Highlights
Core Components Installed
- Icinga2 Core: Main monitoring engine
- Icinga Web 2: Web interface and dashboard
- LAMP Stack: Apache, MySQL, PHP via tasksel
- Nagios Plugins: Standard monitoring plugins
- MySQL IDO: Database backend for Icinga2
- Webmin: Web-based system administration
- PHPMyAdmin: Database management interface
- Docker: Container runtime for clients
Key Configuration Steps
- Added Icinga2 official repository: packages.icinga.org
- Configured PPA: ppa:formorer/icinga
- Updated package lists and upgraded system
- Installed build-essential and development tools
- Created 'icinga' database with appropriate privileges
- Imported MySQL IDO schema from /usr/share/icinga2-ido-mysql/schema/
- Configured ido-mysql.conf with database credentials
- Enabled ido-mysql feature:
icinga2 feature enable ido-mysql
- Created Docker containers with specific hostnames and port mappings
- Installed LAMP stack using
apt-get install lamp-server^ - Configured timezone with tzdata for accurate logging
- Edited /etc/hosts for name resolution across all servers
- Installed Icinga2 and Nagios plugins on each container
- Modified hosts.conf to define monitoring targets
- Configured services.conf with HTTP and MySQL service checks
- Added custom MySQL monitoring service with database connectivity checks
- Commented out unnecessary services to focus on specific targets
- Ran
icinga2 node wizardto setup master node
Monitored Services
| Client Server | Service Type | Check Command | Description |
|---|---|---|---|
| mosudi.web | HTTP | check_http |
Apache2 web server availability and response time monitoring |
| mosudi.db | MySQL | check_mysql |
MySQL database connectivity and service health monitoring |
All other default services were disabled to focus monitoring on specific
application-critical services. Configuration files: /etc/icinga2/conf.d/hosts.conf and
/etc/icinga2/conf.d/services.conf
Network Topology
ip-172-31-46-140
172.17.0.1"] WebUI["Icinga Web 2
Dashboard"] MySQL_IDO["MySQL IDO
Database"] end subgraph Docker["Docker Environment"] WebServer["Web Server Container
mosudi.web
172.17.0.2
Ports: 804:80, 10004:10000"] DBServer["Database Server Container
mosudi.db
172.17.0.3
Ports: 805:80, 10005:10000, 3309:3306"] end Internet --> Master Master --> WebUI Master --> MySQL_IDO Master -.->|Monitor HTTP| WebServer Master -.->|Monitor MySQL| DBServer WebServer -->|Apache2| WebService[HTTP Service] DBServer -->|MySQL| DBService[Database Service] style Master fill:#e3f2fd style WebServer fill:#e8f5e9 style DBServer fill:#e1f5fe style WebUI fill:#fff3e0 style MySQL_IDO fill:#fce4ec
Technologies Used
- Icinga2
- Icinga Web 2
- AWS EC2
- Docker
- Ubuntu 18.04 LTS
- Apache2
- MySQL
- PHP
- Nagios Plugins
- Webmin
- PHPMyAdmin
Technical Implementation
Master Server Setup
- Icinga2 installed with IDO MySQL backend
- Icinga Web 2 with authentication and monitoring modules
- Setup wizard completed via web interface
- Node wizard configured for master role
- SNMP and NTP services configured
Client Configuration
- Docker containers with isolated networking
- LAMP stack deployed on each container
- Icinga2 agents with Nagios plugins
- Custom service definitions in conf.d directory
- Host resolution via /etc/hosts configuration
Security & Access
- Webmin for web-based system administration
- MySQL root authentication configured
- Separate database users for Icinga2 and applications
- PHPMyAdmin for database management
Monitoring Features
- Service health checks with configurable intervals
- Custom MySQL database connectivity monitoring
- HTTP response time and availability tracking
- Real-time alerting and notification system